Stop Guessing. Start Profiling. Leverage Data-Backed Risk & Reward Insights in your Trading Journey.
Gain a Competitive Edge by Exploring Historical Backtested Models to Support Your Live Trading. Get started today with a Free Trial
Disclaimer: StockProfiler.io is a market research tool. We are not licensed financial advisors. All information presented is for educational and informational purposes only and should not be considered financial advice, investment recommendations, or a solicitation to buy or sell any security. Trading stocks involves substantial risk. Most Traders are unprofitable. Past performance does not guarantee future results.
Features & Benefits
Advanced Stock Profiling Engine
Developed over 6+ years of market behavior research, our algorithms identify stocks that match historically backtested patterns associated with strong price movements and Risk to Reward profiles.
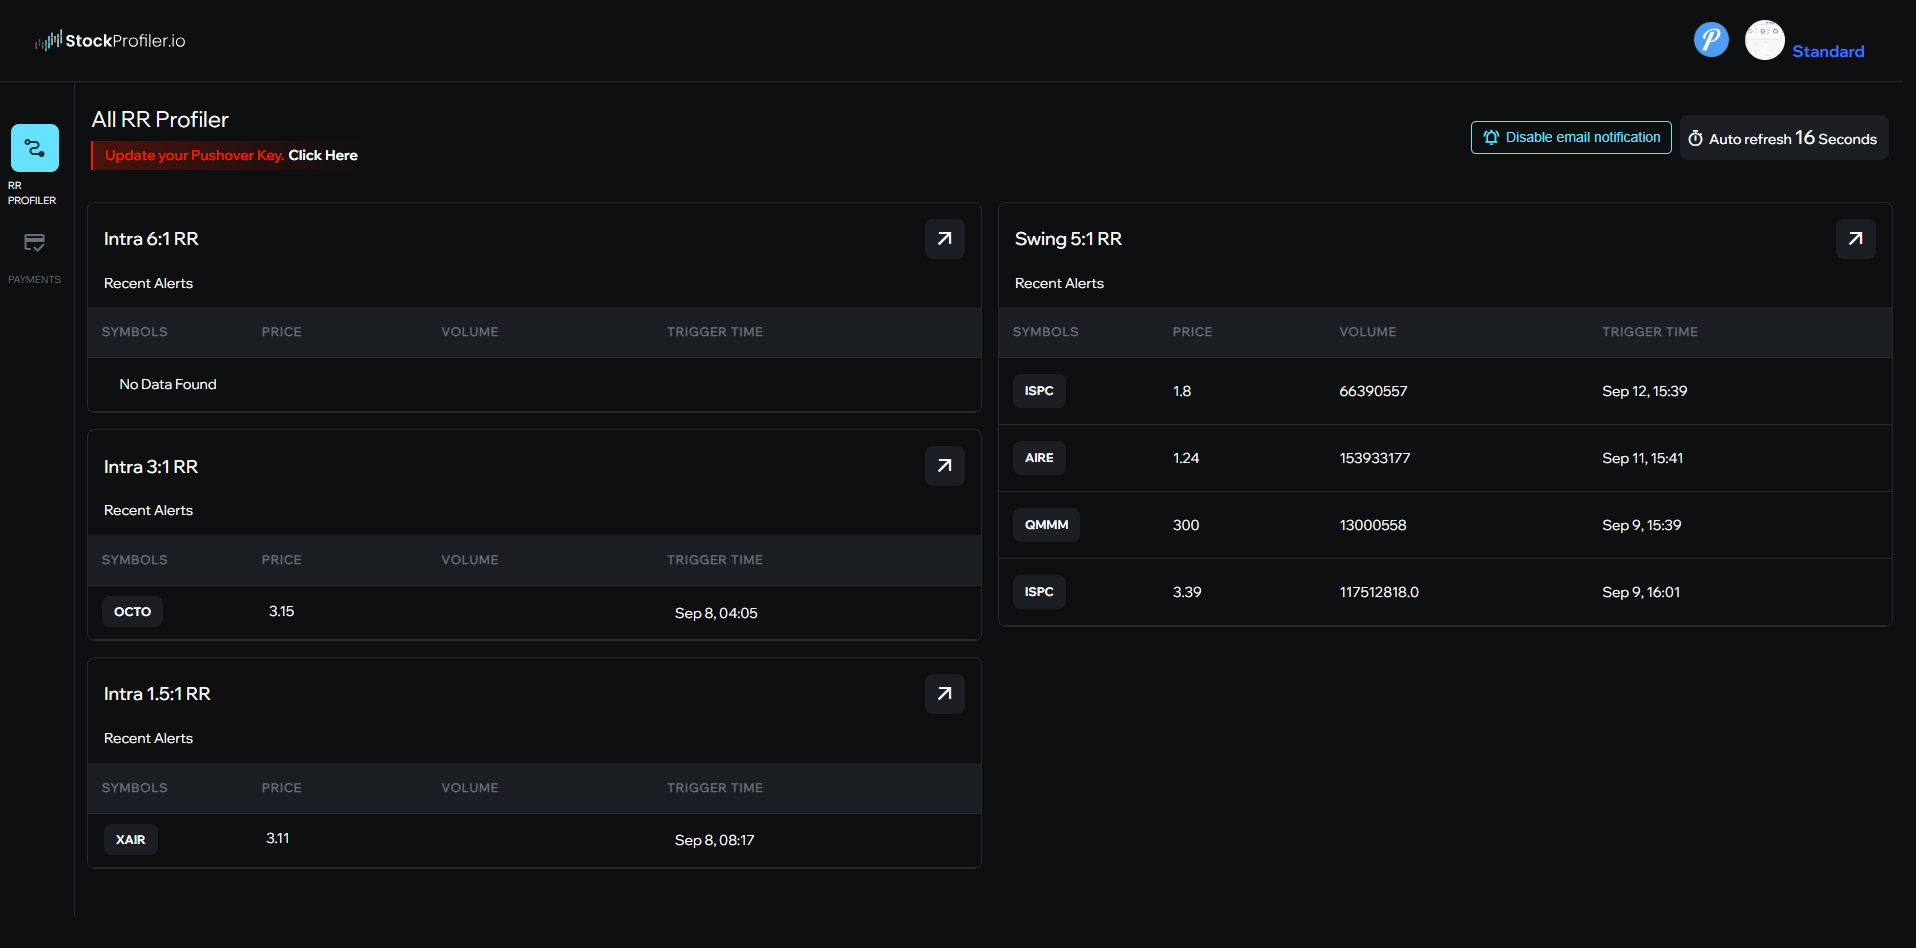
Risk-to-Reward Categorization/Labeling
Every alert is grouped by backtested risk-to-reward models (e.g., 6:1, 3:1, 1.5:1), allowing you to explore how different stocks aligned with historically favorable RR setups & performance.
Real-Time Symbol Scanning
Stocks are continuously scanned against our proprietary logic with minimal delay, helping users stay up to date with current market activity.
Last 6 months History & Transparency Log
Users can explore the model’s past observations and independently assess how similar setups unfolded. This builds trust and supports deeper personal research.
Push & Email notification
Stay informed when a stock enters one of our profiled categories with optional real-time push & email notifications
Intraday & Swing models
Focus your research on the type of market behavior that aligns with your interests, whether you’re analyzing short bursts of volatility(intraday) or extended price action over several sessions(Swing).
Noise Reduction Filtering
Cut through the market noise with algorithms designed to ignore low-probability setups and focus only on high-quality profiles. This reduces analysis paralysis, saves you time, and helps you concentrate on the setups that matter most.
Frequently Asked Questions
Got Questions? We’ve Got Answers.
What does Reward to Risk Categorization/ Labelling mean?
A stock labeled as 6 to 1 RR means it shares similar charactertistics to stocks that were backtested and traded by our algorithms that resulted in a Reward of 6 times the Risk actualized in backtest trading. This process includes a proprietary scoring system and a proprietary buy and sell system based on many factors(Probabilty scores, risk rewards scoring, News story and both Long and short approach) to acheive these results.
How is this any different than a traditional screener or alerting system?
StockProfiler.io is not a traditional stock screener or alerting service. Traditional screeners filter stocks based on static criteria like volume, price change, or RSI. Alerting services often push out buy/sell signals or trade recommendations.
What sets us apart:
- Built in Strategy. Our Risk Reward system is powered by a predictive backtested system that has profiles thousands of stocks and their characteristics.
- Probability scoring. Each stock is scored based on how closely it aligns with historical movement patterns.
- Backtested research. Triggers are tied to modeled RR profiles (e.g., 1.5:1, 3:1, 6:1), not technical indicators alone.
- Transparency over time. You can review historical trigger logs to assess consistency for yourself.
- Top News Stories: We share the news headlines our algos prioritze to trade to achieve profitablity
We provide data & probabilty, not direction — empowering independent traders and researchers to explore historical patterns without hype or assumptions.
Do backtested results hold up in Live Trading?
The results presented by StockProfiler.io are based solely on historical backtesting of market behavior. While these models have been refined over several years of research, past performance does not guarantee future results. Market conditions change, and no model can account for all variables in live trading.
Some users may choose to apply the research in their own live trading strategies, but we do not make any claims about future performance or outcomes. StockProfiler is strictly a research tool — not a trading system or advisory service. How the insights are used is entirely up to each individual user.
What type of stocks does your product focus on?
Our algos focuses on stocks in the Mid to Nano Market Cap segments of the market. These segments usually provide the most volatility based on our historic research needs to meet our Reward to Risk performance standards.
We are also in the process of building a Swing version for 1 billion + Market cap stocks.
How can i see historical performance to build confidence in your product?
We provide access to historical stock triggers(Standard plan only) and their price movement after profiling — all based on backtested data. This allows you to independently explore how past triggers aligned with our algorithmic models and how those stocks moved after meeting the criteria. Also check our results section to see the last month of results for each of our models.
Do you share trading strategies and content also?
Yes— we do share trading strategies our backtested algo uses to maintain a profitable edge.
StockProfiler.io is strictly a research and analytics tool. Our platform provides access to backtested stock profiling data and risk-to-reward model tags based on historical market behavior. How you interpret or use this data is entirely up to you.
How often does the algorithm scan the market?
Our algos scan the markets every 30 seconds from 4am to 8pm. Because of our proprietary logic our intraday algos stop giving triggers at 11am and start given Swing trade triggers at 3:35pm each day.
Why does the same stock appear in multiple RR profiles?
Our algorithm analyzes each stock across multiple backtested models with distinct risk-to-reward (RR) profiles. A single stock can exhibit characteristics that align with more than one profitable pattern—such as setups that match both conservative (1.5:1) and aggressive (6:1+) strategies. By labeling the stock with multiple RR profiles, we give traders a broader perspective on how the stock might behave under different scenarios and at different intervals.
Try It Free.
Disclaimer: StockProfiler.io is a market research tool. We are not licensed financial advisors. All information presented is for educational and informational purposes only and should not be considered financial advice, investment recommendations, or a solicitation to buy or sell any security. Trading stocks involves substantial risk. Past performance does not guarantee future results.